How to integrate JQueryMaps in Asp.net MVC
What is jQueryMaps?
JQueryMaps is a whole new approach to interactive maps. jQuery map is designed to provide great vector graphics, dynamic navigation, and extraordinary user experience without the restrictions of Flash.
JQueryMaps can be used on any device: PCs/Macs (Chrome, Safari, Internet Explorer, Firefox, Opera…), tablets (iPad, Android, Windows…) or smartphones (iPhone, Android, Windows, RIM…). The map just uses standard JavaScript, jQuery and HTML5 to run.
How It Works:
Basically, jQueryMaps consists of a set of JavaScript classes that you instance and interact with from your own JavaScript code. jQueryMaps classes make use of the jQuery library, so it needs to be included in the header. jQueryMaps.Map is the main class for creating a map, and the only one required in most projects. The rest of the classes provide some utilities and the structures to create the data straight from your JavaScript code, instead of loading XML feeds.
In order to display a specific map, jQueryMaps needs basically a background image (in PNG, JPEG or GIF format), a set of features (the polygons or lines that color code the map) and, optionally, a set of markers (landmarks on top of the map). All of these are provided with your project.
There are two ways to use jQueryMaps:
- Having it load the data from XML feeds This is the way most of our clients use jQueryMaps.
- Creating the data straight from your JavaScript code. This can be useful in specific cases.
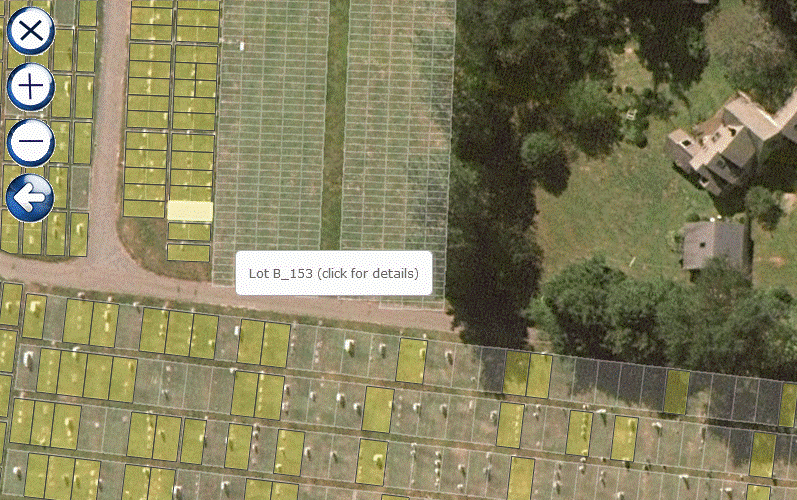
Below is the Example of Map of Particular Region with detail information.
jQueryMaps Concepts
There are just a few concepts that need to understand:
1. The Map Class: The Map class is the main jQueryMaps class.
jqmMap = new jQueryMaps.Map(params);
Those params are the parameters you pass along to the class constructor, telling jQueryMaps how the map should look and behave. This includes the size of the map in pixels (width and height), where to load its general configuration (configURL), etc. You will find a full explanation on how to instance the jQueryMaps object and a reference to all the valid parameters in the Map Class Instancing Reference section.
2. General Configuration (JQMConfig file)
The first thing you need to set in jQueryMaps is its general configuration, such as establishing the images for the zoom in/out buttons, how much zoom in/out is applied upon each click, if you want the user to pan the map, etc. As these features are not often changed, you can normally use the XML file which Jquery provide and make modifications if needed.
3. Themes
In jQueryMaps, a theme is a single map on its own. For example, a theme could be a map of the world showing your international branches. A second theme could be a map of the US states color coded by last year’s sales, and a third could be another map of the US, just showing dots for your warehouses and curves representing the traffic between them. In many projects, only one theme is ever used, but it is also very common that, when clicking on an area like a state), a child theme is loaded (like the counties within that state).
In the theme you can specify:
The cartography you are going to use (world countries, US states, US zip codes, US congressional districts, European provinces, custom regions, etc.).
The URLs to load the features and markers as XML feeds.
The URLs to load the feature and marker categories as XML feeds. This is where you normally set their look and behaviour.
4. Features
In jQueryMaps, a feature refers to the geographic elements in the map. Normally, the features are always polygons, but they may also be polylines or curves.
Each feature needs to have an ID (which points to the corresponding shape, the geometry in the cartography) a label and a category. In addition, the feature may have any other custom properties you want to display when it is hovered over or clicked, such as the address of a representative, sales, or number of incidents).
You can configure the feature fill and border colors, and the actions to trigger when you hover over or click on it.
Features are normally loaded from a URL which is specified in the theme….
<feature id=”us_ak” category=”state” label=”Alaska” unitsSold=”5,167″ sales=”$5,156,788.00″ contact=”Mark Almond” phone=”555-167-1788″ />
<feature id=”us_al” category=”state” label=”Alabama” unitsSold=”15,726″ sales=”$15,586,287.00″ contact=”Rod Stewart” phone=”555-167-1788″ />
5. Markers
In jQueryMaps, a marker is a landmark on the map, representing an important point. Each marker needs to have an ID, a label, a category and its coordinates (latitude and longitude). In addition, the marker may have other custom properties that you want to display when it is hovered over or clicked on, such as the physical address, the phone number, Markers are normally loaded from a URL specified in the theme. That URL may point to a plain XML file or a dynamic page querying a database and returning the corresponding XML feed. This is what the marker nodes look like:
…
<marker id=”3476″ category=”city” label=”Miami & Dale” lat=”25.7738889″ lon=”-80.1938889″ population=”425,986″ />
<marker id=”13065″ category=”city” label=”Omaha” lat=”41.2586111″ lon=”-95.9375″ population=”430,227″ />
6. Categories
In jQueryMaps, a category is a group of features or markers that you want to look and behave in the same way. For example, on a US states map, you may want to assign a blue color to states where you have points of sale, and, when users hover over one of these states, display an info window with the list of stores, their addresses and phone numbers. This is how these feature category nodes would look like:
…
<featureCategory id=’served’ enabled=’true’ >
<featureStyle event=”onmouseout” fillColor=’rgba(128, 128, 255, 1)’ strokeColor=’#4040ff’ strokeWidth=’1′ />
<action event=”onmouseover” target=”infowindow” infowindowDiv=”stateInfoDiv” align=”mouse,20,20″ />
</featureCategory>
<featureCategory id=’notServed’ enabled=’false’ >
<featureStyle event=”onmouseout” fillColor=’rgba(200, 200, 200, 1)’ strokeColor=’#f0f0f0′ strokeWidth=’1′ />
</featureCategory>
So basically JqueryMaps will provide Shape file in format of XML file and JPG file for map background.
We just need to develop HTML file and need to provide feature file URL from our MVC action method where we can generate Feature category file from our database as per our purpose like
Below is the Example of HTML, MVC Action, Theme URL and JQM Config file:
Creating Your First Map:
HTML FILE with the comments so that we can easily know the purpose of each line.
<!DOCTYPE html> <!– Declare this page as HTML5 –>
<html>
<head>
<!– Internet Explorer 8 and lower HTML5 support via Google ExplorerCanvas –>
<!–[if lt IE 9]><script src=”jquerymaps/libs/excanvas/excanvas_tagcanvas.js”></script><![endif]–>
<!– Some basic styling –>
<link href=”css/basic.css” rel=”stylesheet” type=”text/css” />
<!– jQuery and jQuery-UI libraries –>
<script src=”http://ajax.googleapis.com/ajax/libs/jquery/1.6.4/jquery.min.js”></script>
<script src=”http://ajax.googleapis.com/ajax/libs/jqueryui/1.8/jquery-ui.min.js”></script>
<!– jQueryMaps library –>
<script src=”jquerymaps/libs/jquerymaps/jQueryMaps.js”></script>
<script>
// Declare the map object here, so it can be used anywhere
var jqmMap;
// When everything is loaded, create the map
$(document).ready(function(){
// Set the parameters to create the map
var params = {
// The DIV that will contain the map
mapDivId: “mapDiv”,
// The general configuration XML file
configUrl: “jquerymaps/jqm_config_basic.xml”,
// The initial theme (children themes may be loaded later on)
initialThemeUrl: “jquerymaps/themes/usa_states-counties/usa_states_basic_theme.xml”
};
// Create the map by instancing the Map class
jqmMap = new JQueryMaps.Map(params);
});
// The map calls this function when a state has been clicked
function stateClicked(obj) {
alert( “You have clicked on ” + obj.label + ” (” + obj.stateAbbreviation + “), with ID ” + obj.id + “, and category ” + obj.category + “.”);
}
</script>
</head>
<body>
<!– The DIV that will contain the map –>
<div id=”mapDiv” style=”width:900px; height:600px;”></div>
<!– The DIV to display close to the mouse pointer when the user hovers over an state –>
<div id=”onMouseOverInfoWindowDiv” class=”onMouseOver”>You are hovering over ##label##!</div>
</body>
</html>
MVC ACTION TO LOAD FEATURES CATEGORY:
public void MapData(string id, string type = “”)
{
Guid cemetery = cemeteryId.ToGuid();
List<MapLotItem> mapLotItems = new List<MapLotItem>();
Response.Write(@”<?xml version=’1.0′ encoding=’utf-8′?>
<jqm_features>”);
Response.Write(@”
<feature id=’buildings’ category=’buildings’ label=’Building’ />
<feature id=’ponds’ category=’ponds’ label=’Pond’ />
<feature id=’blocks’ category=’blocks’ />
<feature id=’fences’ category=’fences’ />”);
////<feature id=’texts’ category=’texts’ />”);
// get the data from database based on our need here and loop the data
foreach (MapLotItem mapLotItem in mapLotItems)
{
string mapLabel = mapLotItem.Lot;
string maplot = mapLotItem.Lot;
Response.Write(“<feature id='” + maplot + “‘ category='” + mapLotItem.Category + “‘ label='” + mapLabel + ” (click for details)’ />\n”);
////Response.Write(“<feature id='” + maplot + “‘ category='” + mapLotItem.Category + “‘ label='” + mapLabel + ” (click for details)’ />\n”);
}
}
else if (type.ToLower() == “navigation”)
{
Response.Write(@”<feature id=’sectiontexts’ category=’sectiontexts’ />”);
Response.Write(“<feature id=\”roads\” category=\”roads\” />\n”);
}
Response.Write(“<feature id=\”texts\” category=\”texts\” />\n”);
Response.Write(@”</jqm_features>”);
}
CONFIG FILE
<jqm_config version=”001.002.001″ license=”jqm-0023-0871″
authorizationFile=”jqm_authorization.txt”
loadingSpinnerUrl=”images/misc/spinner.gif”
transparentImageUrl=”images/misc/transparent.gif”
zoomFeatureFrames=”2″ zoomFeatureMargin=”10″
zoomFeatureMinScale=”250″ zoomButtonFrames=”1″
zoomButtonsFactor=”4″ zoomMouseWheelFactor=”0.05″
zoomMouseWheelFrames=”2″ previousLevelAlpha=”0.8″
applyAlphaToCurrentLevel=”false” allowCaching=”Yes”
fromMapJsFunction=”jqmFromMap” loadingInfoDiv=”jqm_loader” >
<toolbar align=”top-left”
orientation=”vertical”
margin=”10″
buttonsPath=”images/toolbars/”
buttonsExtension=”png”
showCloseButton=”false”
showZoomButtons=”true”
showInitialViewButton=”false”
showSelectModeButton=”false”
showFullScreenButton=”false”
showHelpButton=”false”
showPrintButton=”true” />
<functionality zoomInOutWheel=”Yes” pan=”Yes” />
<_platformDisplay id = “_default” displayMode = “regular” />
<_platformDisplay id = “_default” displayMode = “viewport” align=”center,0,0″ />
<_platformDisplay id = “default” displayMode = “fullScreen” />
<_platformDisplay id = “tablet” displayMode = “fullScreen” />
<_platformDisplay id = “phone” displayMode = “fullScreen” />
<textStyle id=”sectiontexts” fontName=”verdana” italic=”true” fontBold=”true” align=”bottom-left” />
<textStyle id=”sectionNo” fontName=”arial” fontSize=”12″ align=”center” fillColor=”#88f” />
<textStyle id=”texts” fontName=”verdana” fontBold=”false” align=”bottom-left” fillColor=”#000″ />
<style event=”onmouseover” fillColor=”rgba(255, 255, 255, 0.5)” />
<style event=”onhighlighted” fillColor=”rgba(255, 255, 127, 0.8)” strokeColor=”#888″ strokeWidth=”1″ />
<!–<action event=’onmouseover’ target=’infowindow’ url=’themes/infowindows/mouseOver.html’ align=’mouse,20,20′ />–>
</jqm_config>
THEME FILE
<?xml version=”1.0″ encoding=”UTF-8″?>
<jqm_theme
id = ‘bosscan_sections’
shapesUrl = ‘/Jquerymaps/maps/shapefile.xml’
backgroundImageLowResUrl = ‘/Jquerymaps/maps/LowRes.jpg’
backgroundImageUrl = ‘/Jquerymaps/maps/HighRes.jpg’
featureCategoriesUrl = ‘/Jquerymaps/Framework/feature_categories.xml’
featuresUrl = ‘/Map/MapData?id=##’
limitPan = ‘false’
limitZoomOut = ‘false’
>
<platformFunctionality
id = ‘default’
displayRegularPolygons = ‘true’
displayBgImages = ‘true’
/>
<!–<letteredLabel attributeName=’sectionNo’ textStyle=’sectionNo’ />–>
<action event=”onclick” target=”js” jsFunction=”displayLotData”/>
</jqm_theme>
Conclusion:
This document is a technical guide to jQueryMaps. It provides basic information a developer should need to understand how jQueryMaps works, what can be achieved with the product and how to implement it within our MVC Project.