
Get Started with Microsoft Power BI Data Visualization To Make Smart Business Decisions
Those who seek improved and result-driven data handling are well-aware of Microsoft Power BI as this one single tool is known to create feature-rich and insightful reports from multiple domains. Starting from data preparation to data analysis, everything is going to be full of perfection with Power BI data visualization.
Know more about what Power BI does, the importance of Microsoft Power BI adoption, viable Power BI reporting strategy, and many other related aspects as this blog moves ahead towards choosing the right Microsoft Power BI implementation partner.
Microsoft Power BI Data Visualization – Bring Harmony to Multiple Data Sets
Offered by Microsoft Power BI is a collection of feature-rich applications, software services, connectors, tools, and many other resources that work inter-relatedly so that data is handled correctly, result-driven insights are earned, and decision-making ability is improved. All of this information is presented via immersive reports, accessible via the Power BI dashboard.
Functionality-wise, Microsoft Power BI is a cloud-based Business Intelligence solution offered with a myriad of functionalities. The three main components of Power BI are Power BI desktop, Power BI service, and Power BI mobile application.
Power BI desktop is a window-based application, while Power BI service is a SaaS application. As the name suggests, the Power BI mobile application is working on Android and iOS.
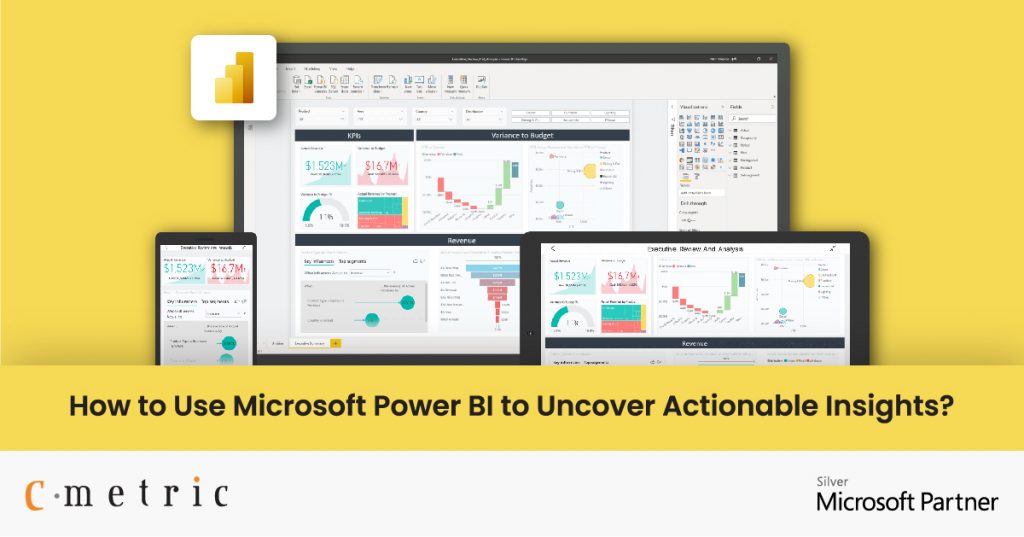
Using the Power BI dashboard, reports are created and shared across the platforms to make sense of the report and use it to make crucial decisions.
Why Choose Power BI As Your Business Intelligence Tool
Power BI has gained an edge and becomes a trusted choice of many industry leaders among all the other BI tools. But, why Power BI data visualization? What makes it exceptional or better than its counterparts. Well, we will present you the reasons next.
-
Connecting with data is easier than ever
Power BI is amazingly easy and brings data together with zero added fuss resulting in improved accessibility, visibility, and utility.
At present, more than 70 connectors are offered to the end-users using which, one can access data from multiple cloud platforms like OneDrive, DropBox, Azure, and SalesForce. That’s not the end of it as data can be fetched easily from Excel spreadsheets, CSV files, and SQL databases.
These tailored-made connectors allow end-users to create enriched Power BI dashboards from scratch. Customization at its best is offered as well. As the interface is drag-and-drop based, no copy-paste job is required. In short, having direct access to data stored anywhere, is possible with Power BI.
-
A high-performing data modelling engine
With Power BI data visualization, you get Power Pivot, which is the world’s most powerful and performance-oriented columnar database. The data modelling engine is based on inventive tabular database technology that efficiently compresses databases that data is completely loaded into memory. When it happens, the best possible performance is certain.
Improved performance is certain because of one more thing as it’s a highly optimized Power BI workbook that optimizes according to the database load.
-
Data visuals of the highest kind
Say no to boring data presentations that make crucial facts boring and dull as Power BI presents a feature-packed data visual feature.
The Microsoft Power BI data insights can easily integrate with the reports and present data using means like pie charts, tables, waterfall, line, map, matrix, bar, and many others. Each present data mean comes with a superb customization facility. So, one has the freedom to present data as per the wish and need of the hour.
-
Compatibility with R
We know the world is in awe with the Power BI simplicity. But, it has also handled complex operations and can be a tool for advanced data handling. This additional strength came from its integration with R, a globally recognized open-source programming language.
With R, it’s easy to handle and process complex data and statistical computation. Power BI customers have the facility to integrate with R directly from the dashboard.
-
Similarity with Excel
Power BI doesn’t demand extensive training and rehearsal to make the most of it as it shares great similarities with Excel. If you know the nitty-gritty of Excel and then getting started with Power BI is easy.
The embedded self-service tool of Power BI, Power Query, is also very much similar to Excel. So, its integration, utilization, and transformation are easier than ever. It simplifies the Power BI reporting strategy design and makes it accessible for everyone.
-
Data security at its best
With Power BI, it’s easy to integrate best security practices in data handling as it helps you attain key compliances and regulatory standards. Also, AAD or Azure Active Directory assists greatly in user authentication. It also helps you leverage SSO or Single Sign-On facility. In short, improving data security and compliances is easy with Power BI.
Implementing Microsoft Power BI Cloud Service – Do the Job with Perfection
We have qualms to admit that Microsoft Power BI data visualization is here to make things better than before on the data handling front. But, it’s not always that useful and smooth journey. Certain issues are there that should be addressed diligently to reap maximum benefits out of implemented Power BI solution.
For instance:
- Data security is not adequate to keep data secured by all means. Advanced cyber security threats can still make it to your data and harm it.
- Compliance is not internally and externally covered
- There are no reports on security procedures
- Updates are too frequent, and one needs to make peace with them. Power BI Desktop is updated monthly, and organizations need to make adequate changes to adopt the updates seamlessly.
If not addressed properly, these challenges can create much havoc and hassles in the end-to-end implementation of Microsoft Power BI. However, remedial of these challenges is not as easy as it seems as it demands a deeper understanding of Power BI and its features.
Wondering how a Microsoft Power BI implementation partner enhances your analytics capabilities?
Wellbeing Microsoft certified solution provider, we make sure to provide quality solutions in the spear of Microsoft Technology. C-Metric is a Microsoft Silver partner offering expert assistance in Power BI implementation. We have a seasoned team and skilled experts having a deeper understanding of Power BI data visualization.
With need-based implementation and customization, C-Metric – The Microsoft Silver Partner – ensures that Power BI is in full swing at your service and is delivering the best ROI.
FAQs
- Why should you use Power BI data visualization?
Power BI provides flexibility to publish the reports across the enterprise as per the pre-defined and selected criteria. Integrating MS Power BI with your existing business environment with a personalized dashboard is really convenient. This one-stop solution turns data into insights, making it feasible to explore data by visualizations.
- What kind of analysis can Power BI do?
MS Power BI provides comprehensive metrics and key performance indicators through interactive and intuitive dashboards- all in real-time and all in one place. Data-intensive reports and visualizations using the data models.
- Can Power BI do advanced analytics?
There’s a special feature in Power BI that allows business users to analyse and share insights across all levels of the organization whether they are charts, reports or others. Beyond traditional BI, Power BI discovers deeper insights, makes accurate predictions, and gives insightful recommendations.